So what about the other states?
From our original map, a big swath of the midwest is in the “more Republican shift than explained by education” category. We’ve already covered several states: Ohio, Wisconsin, and Minnesota. I’d like to focus on some of those states that made the most difference:
- Pennsylvania
- Michigan
- Iowa
Between these and the states we have already covered, we will have analyzed 5 of the 6 states that flipped in 2016. These will be shallower dives, because you have already seen the broad strokes of major trends in states we have covered, and (honestly) because that level of deep dive takes a long time.
Iowa
Iowa, like its neighbor Wisconsin, saw an enormous downturn in Democratic turnout across the state. It really didn’t matter which year’s Republican vote total you used, or that Trump made gains, because the 2016 Democratic showing was the worst party showing by votes since at least 2004.
This really shows up in the distributions of turnout by county. A huge fraction of the Iowa counties had a third of Democratic voters not repeat a Democratic vote in 2016. This is not terribly far off in impact from only Democratic voters getting Thanos-snapped, and about as devastating for Hillary’s prospects.
These votes were winnable, and it seems misleading to blame the flip of Iowa on racist Republicans; Iowans handily elected Obama twice. Rather than blaming the other party, Democrats should figure out why the could not turn out historic voters.
Bernie
Some people have blamed disaffected Bernie voters for Iowa’s poor turnout. It is true that Iowa was an early success story for Bernie, who lost the primary extremely narrowly early in 2016. But we have Bernie support rates by county from the caucuses. What should the relationship between change in Democratic turnout and Bernie support look like if either the Bernie supporters did not vote, or voted Republican? In theory, there should be a negative relationship between Bernie support and Democratic turnout (if they don’t show), or a positive relationship between Bernie support and Republican turnout. We see neither of these things.
This analysis isn’t perfect; as one of my readers pointed out, caucuses aren’t a scientific measure of support because they preferentially select for people who can spend an entire day caucusing. However, this is the best data I am aware of and doesn’t match the hypothesis, which counts for more than zero. If there is a better source to support the “blame Bernie voters” explanation, please share!
Michigan
Michigan matches its neighbor Ohio in having a very strong linear relationship between education and Republican shift.
Similarly to Ohio, Wisconsin, and Minnesota, Republican turnout stayed relatively flat, but Democratic turnout collapsed.
And in a recurring theme, Republican support was up, but Democratic was much farther down on average across counties.
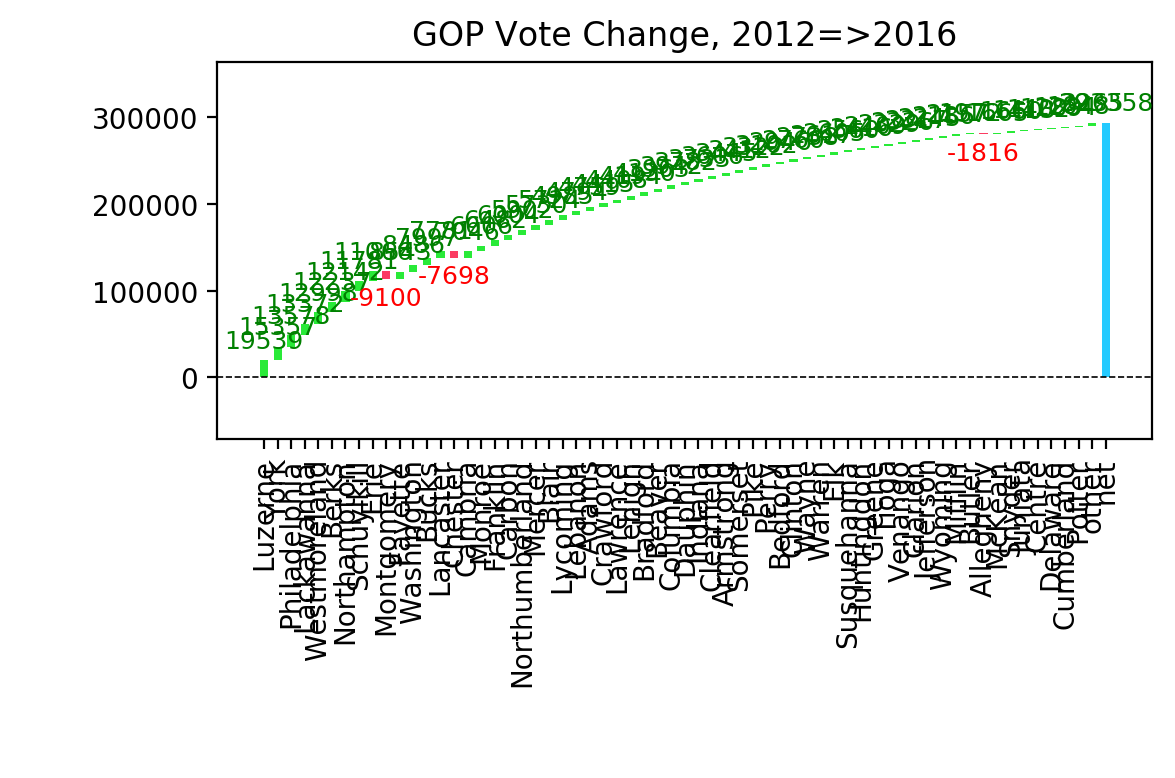
Pennsylvania
Pennsylvania is actually an odd one out compared to the other states. While we have seen a very strong education relationship and Democratic turnout collapsing in other states, Pennsylvania is a state where net Democratic turnout stayed about the same and Republican turnout increased.
While many counties were down in turnout, Chester and Montgomery counties (just outside Philadelphia) increased enough to make up for most of the declines.
In general, the increased Republican turnout was spread across the entire state, with very small quantities everywhere adding up to just enough for Trump to win.